

2017 Global Merchandise Exports
PROJECT MOTIVATION
This project analyzes the 2017 export data across seven regions in the world. Although export data has been rigorously explored by many visualization designers, many of these graphics were dislayed as a line chart, bar chart, or pie chart. A major problem with these three types of chart is that the graph only presents the export performance for one single region at a time, making it difficult to visually compare the export performances across all regions simultaneously. In order to overcome this shortcoming, this project uses a chord diagram to visualize the exports data for all seven regions in the world, making it possible to display how merchandise products were exported from one source region to a destination.
DATA DESCRIPTION
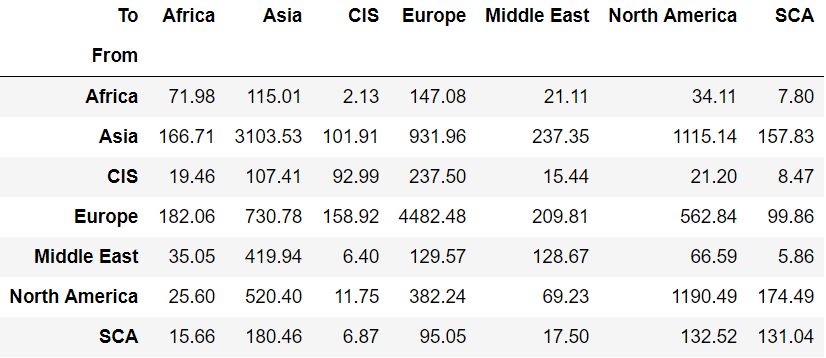
The data is sourced from the statistical database of the World Tade Organization. The regions studied in this project are Africa, Asia, Commonwealth of Independent States (CIS), Europe, Middle East, North America, and South and Central America and the Caribbean (SCA). The time period of the data was 2017. By using Python, the original dataset was processed into a 7X7 matrix as below. All values were recorded in billions of U.S. dollars.
KEY FINDINGS
Export performance was uneven across seven regions in the world. In 2017, Europe was the best merchandise exports performaning region, while Africa was the worst performing region. Europe, Asia, and North America are less dependent on demands from outside regions. On the contrary, Africa, CIS, Middle East, and SCA are highly dependent on demands from Europe, Asia and North America.
© 2019 Winnie Weining Hu. All rights reserved.